Software Development Metrics and KPIs: Achieve Excellence in SDLC

Jayanti Katariya
Last Updated: May 01, 2026
Table of Content
Blog Summary:
This blog discusses how KPIs and software development metrics are essential media to incorporate value into the software and increase business revenues. Keep reading ahead as we explore more on how appropriate usage of data can help tech decision-makers determine the key points where their software development processes need improvement.
Table of Content
Any type of simple or complex software needs a proper allotment of time, resources, and money to help development teams deliver the finest result. A basic design change, the addition of new features, and the change of configurations in a CMS can add almost USD 30,000 more to development costs. In fact, for 10.81% of software organizations, it can take more than 6 whole months to deliver a market-ready product.
The period between starting a software project and its delivery isn’t smooth sailing. Why? Well, because there come a lot of points where you have to measure your processes and identify the areas of improvement.
Approximately 17.70% of companies find continuous performance management to be a major challenge for development teams. So, the question is – how will your development team figure out and measure the value your software will deliver to your customers?
Your software development process is a ship, and software metrics make it smooth sailing, with the data acting as a beacon of delivering value to your customers with continuous improvement.
What are Software Development Metrics?
Software metrics measure quantifiable or countable software attributes that make it crucial. It includes four prevalent management roles planning, organization, control, and improvement.
Several metrics are interconnected throughout the software development lifecycle. They give relevant information to everyone involved in choosing, creating, implementing, and gathering.
Software metrics primarily include:
- Software performance
- Organizing tasks
- Gauging productivity
Why Should You Track Software Metrics?
Software Metrics are helpful for assessing the viability, caliber, and development of a software testing effort. Identifying the value you want to provide is the main objective of implementing software metrics. Without metrics, it would be very difficult to quantify, explain, or show the quality of software.
Metrics also offer a rapid snapshot of the state of software testing efforts, enabling improved control through informed choices. Software testing initiatives have always included metrics, but over time, the kind of data that is gathered and presented has changed.
A specified method of evaluating the goals and effectiveness of the test teams is essential due to the increased priority being placed on the quality of applications. Metrics from software testing are used to accomplish goal-tracking.
Additionally, correctly chosen metrics can help organizations and businesses improve their testing processes and periodically monitor their progress. In addition to discussing the financial advantages of software projects, test suppliers now need to share metrics that demonstrate productivity, efficiency, and efficacy.
The quality of the program can be easily improved and checked. In reality, there is broad consensus that placing an emphasis on quality boosts output and encourages a culture of continual improvement.
The gathering of data is the cornerstone of assessing software and associated processes, allowing us to better control the creation, cost, and quality of software products. There are things that can be tallied and regularly measured, like baseline dimensions, and there are things like flaws, effort, and time that can run on a timetable.
Understand the performance and health of your software to make critical adjustments.
Benefits of Key Performance Indicators (KPIs) for Your Business
Metrics for measuring software quality help managers increase the efficiency of the software development lifecycle. Software metrics also have the following benefits:
- Metrics offer unbiased information.
- These software metrics can be used to prepare software development teams.
- These measurements can be used to foresee issues and prevent a failure mentality.
- The use of software metrics allows for augmentation. The experts are tasked with prioritizing problems and resolving them.
- Metrics for project software development effectively support a proactive management approach. This allows for the resolution of both existing and anticipated problems in or before the appropriate window of the right time.
- Software development metrics are used by decision-makers to evaluate the effects and make wise trade-offs.
- They help in increasing ROI.
For all software development projects, not all metrics are relevant. It is advised to combine precise and objective measurements to provide meaningful answers to practical business concerns.
Powerful Agile Metrics that Can Change the Software Development Game!
Forget about the guesswork and endless meetings. These potent metrics unlatch agility, improve team efficiency, and deliver high-quality software faster than ever.
Here are the agile metrics you should follow for revolutionizing your software development process:
Lead Time
The Lead Time metric calculates the amount of time that elapses between the start of an activity and its completion. It offers you a more comprehensive understanding of how long it takes to complete a feature that a client has requested.
If you use an Agile approach, it can help you spot possible problems that may arise between the time a task is created and when a software developer begins working on it.
Cycle Time
The Cycle Time statistic calculates how long it takes to start and finish an activity. It is crucial for determining how quickly a company is developing.
Team Velocity
The number of software units a team produces during an iteration or sprint is known as team velocity. It is not appropriate to compare software teams using this internal metric. Deliverables are defined differently for each team and change over time for each individual software development team.
Throughput
One of the most important agile metrics is throughput, which is primarily used to track the precise number of jobs completed within a sprint. Once the desired outcome has been obtained, make sure to immediately align it with the ongoing company objectives.
Throughput metric measurement helps with recognizing a team block and discovering whether the crew is overworked. This can be accomplished by contrasting the typical throughput with the workload at hand.
Rate of Open/Close
A given time period’s worth of production difficulties is tracked to determine open/close rates. It’s critical to monitor the trends in software statistics.
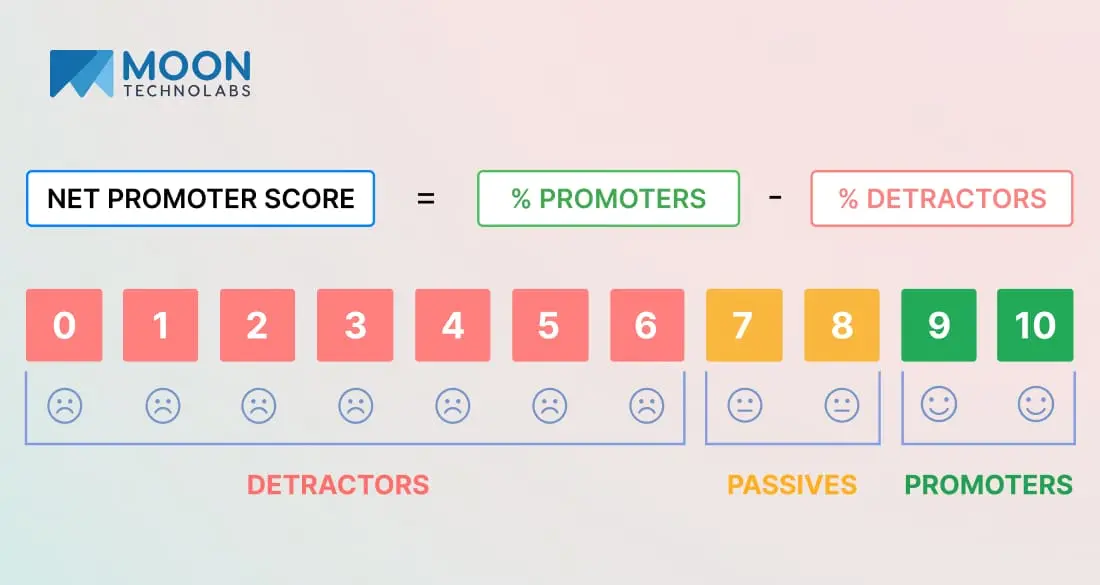
Net Promoter Score
It is another name for customer satisfaction scores. This score measures the customer experience and growth of the business. It includes various scores like the Customer Effort Score (CES) and Customer Satisfaction Score (CSAT). Remember the screen where you are asked the question “How likely are you to recommend this company to your friend or colleague?”
The scale extends to a range of -100 to +100 for customer experience. A customer indicating -100 indicates the worst experience and +100 shows that all your customers are spreading the word about you.
Transform your processes with actionable metrics and KPIs for continuous improvement.
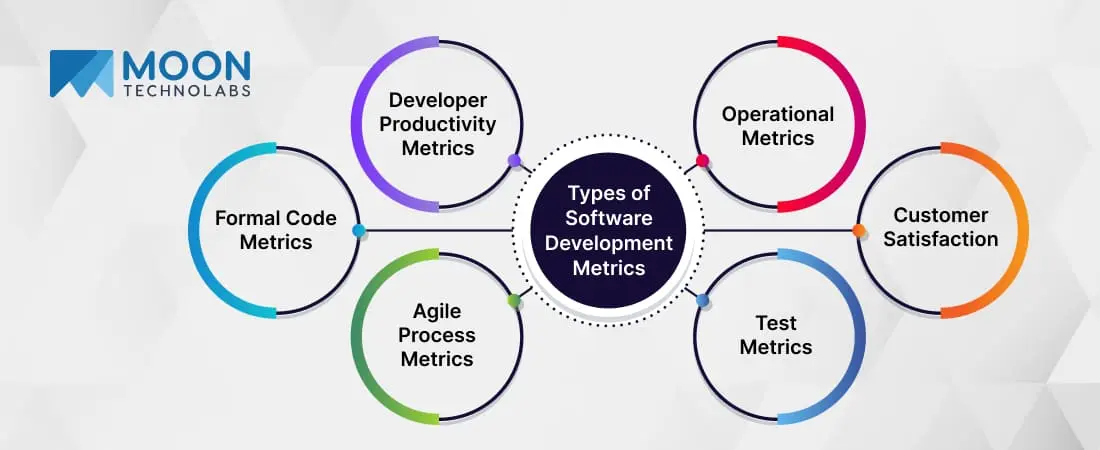
Types of Software Development Metrics
Choosing the right software development metrics can be overwhelming. Therefore, it requires right tools to measure the right metrics. Understanding the contribution of each metric to a holistic view of your project’s health and find the insights to make informed decisions.
Here are the four software development metrics:
- Developer Productivity Metrics
- Operational Metrics
- Test Metrics
- Usability Metrics
Developer Productivity Metrics
Managers rely on productivity indicators to measure team success. Various techniques track progress and workload. Utilize key metrics to assess project health, developer output, and time needed for completion.
Work Log
Based on information from code commits, open/closed PRs, merging commits, and PR comments, the work log offers insightful information. It aids in the visualization of cooperative dynamics and procedural flow. Additionally, it aids in enhanced momentum and quicker delivery by assisting in the discovery of bottlenecks.
Active Days
Code contributions made during the active days of a development project are identified.
Churning Code
Code churn occurs when a piece of code is quickly discarded or rewritten. It is a measure that shows how frequently a particular code is changed. When an engineer finds it difficult to write a particular piece of code, usually because of ignorance or poor teamwork, code churn is unavoidable.
Operational Metrics
Key indicators that let you monitor your business actions in real time are operational metrics. They can be used to boost productivity and evaluate the results of software development. Operational indicators also demonstrate how effectively a business carries out its regular duties.
Mean Time Between Failures (MTBF)
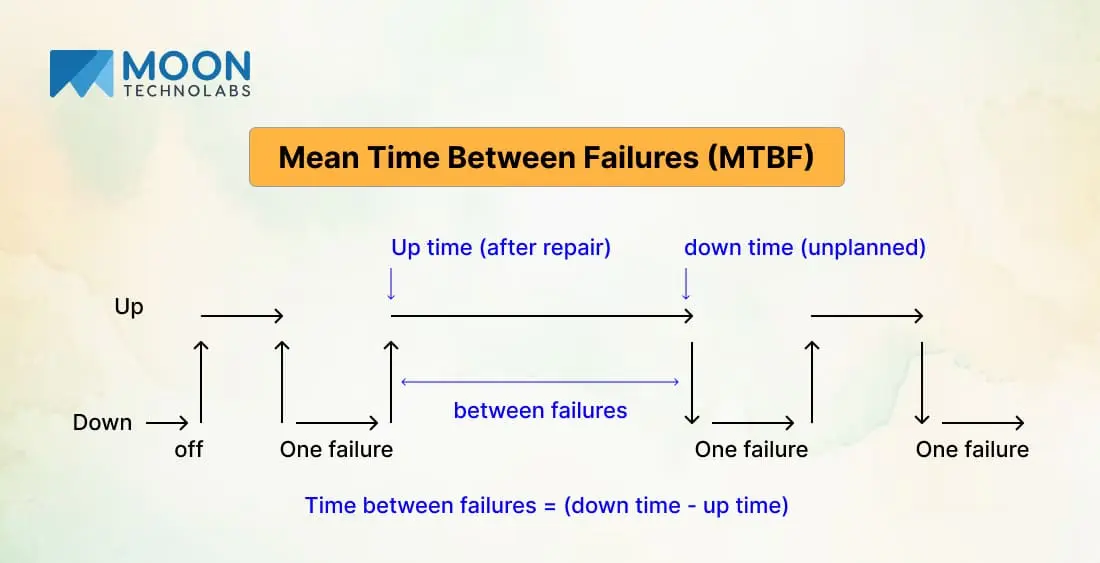
This incident statistic shows the typical interval between a software or technological product’s fixable problems. The reliability of the software generated increases with the length of time between unforeseen problems or outages.
Mean Time to Recover (MTTR)
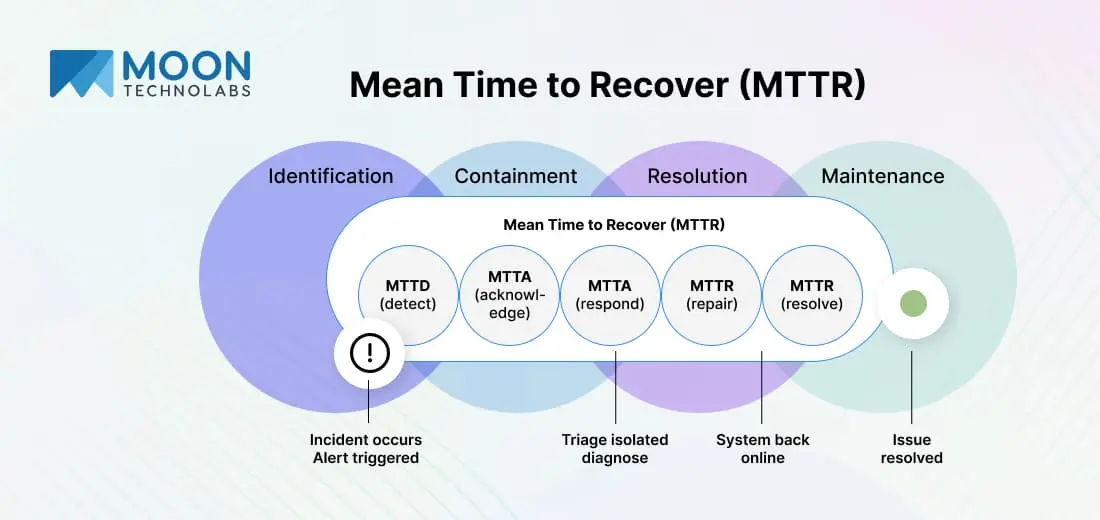
It is a different technical event measure that describes the typical amount of time needed to recover from a system or product breakdown. Use it to determine how long an outage lasts, from the moment something goes wrong to the moment it starts working again. Additionally, it frequently matters when evaluating a team’s stability.
App Crash Rate
It is determined by dividing the number of times the program failed by the number of times it was utilized.
Test or Security Metrics
Software quality is reflected in security measurements. To demonstrate how a software development company creates security responses, these metrics must be tracked over time.
Distribution of Defects
The distribution of faults identifies the area of the software that is most vulnerable to errors.
Code Coverage
This kind of measure calculates the proportion of lines of code that successfully pass a test procedure. As a result, it is possible to assess a software’s verification quality and determine whether the code is understandable and maintainable. Combine it with additional metrics to completely grasp the likelihood of faults in the software.
Commit Risks
The risk metric calculates the likelihood of a risk that a specific contractually committed activity may create. Less risk implies better, more reliable code for users. Moon Technolabs uses it as a pattern-matching engine to search for anomalies.
Usability Measures
Metrics related to usability and customer experience are intimately related. Formally speaking, it refers to the extent to which certain users can use a product to accomplish their objectives. Consider software efficiency, accessibility, memorability, learnability, and satisfaction while performing any usability assessment.
They frequently also take into account users’ emotional reactions, such as how much they trust the particular software. These measurements can be seen as a link between business, product, and design. Because of this, you should additionally consider loyalty and usability.
Software Development Process KPIs
The software development KPIs are some of the deciding factors for the performance of the software. There are 10 software development key performance indicators (KPIs).
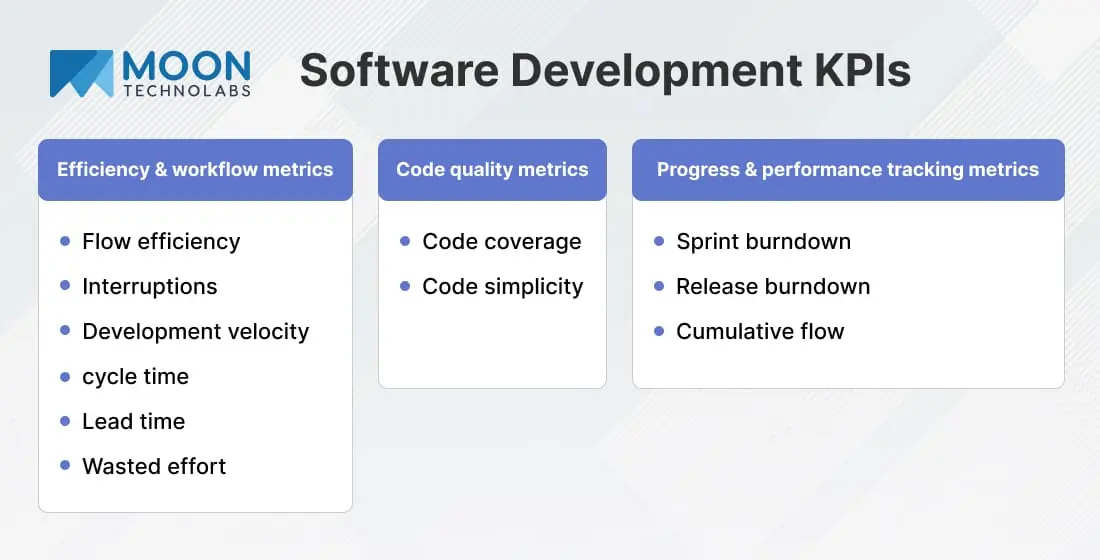
Flow Efficiency
Flow efficiency is the ratio of your active time to your total time.
Work in progress isn’t always what it seems to be. There can be a waiting period before the software developers can start working on a new job or project.
By dividing the time you actively work by your entire cycle time, you can determine flow efficiency.
To better comprehend what caused the shortcomings, you could connect instances of low efficiency to particular time frames.
Interruptions
The number of jobs that are interrupted during a specific time frame can be used to measure interruptions. It’s one of the best practices of development to count not only completed tasks but also interruptions for each individual activity.
Development Velocity
Velocity refers to how much work your development team can complete during a sprint. One of the important parameters in the software development metrics is a sprint a set period where specific tasks are set out to be done in the agile methodology.
Different ways to measure velocity are implemented. The most popular measurement is story points which measure the effort that goes into a software product.
It only takes about three sprints before you will have a good idea of your development team’s average velocity. Development velocity helps in estimating how real the team goals are and with what speed and direction the goals will be fulfilled.
Cycle Time
Cycle time is one of the software development KPIs, which can be calculated as time spent working on a certain task. It is used to measure the efficiency of the software development lifecycle.
Being able to oversee the development process by looking at cycle time charts makes it one of the most well-liked software development KPIs.
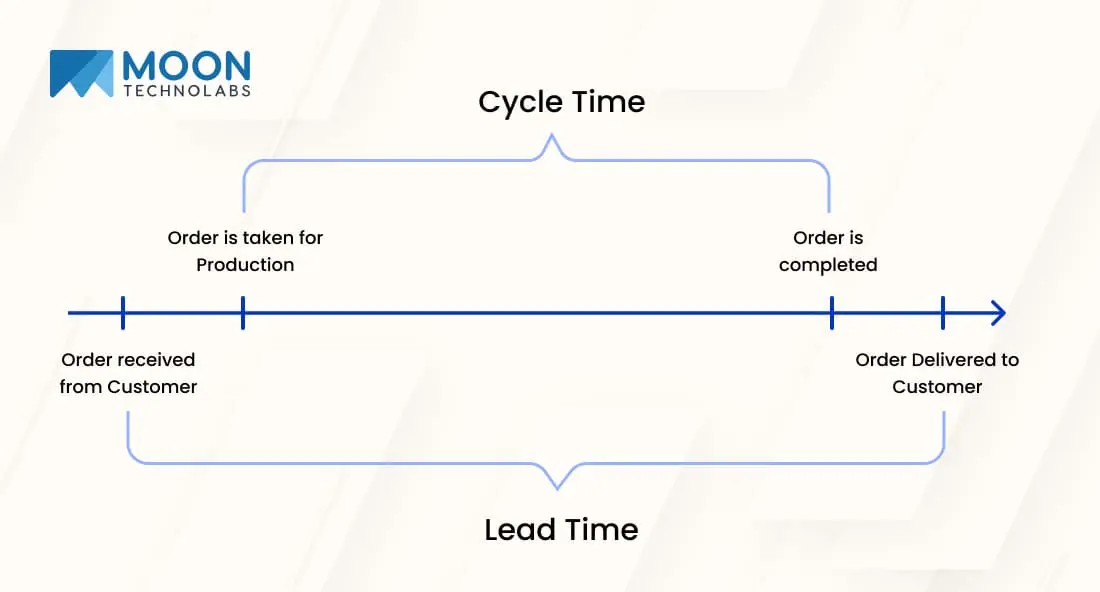
Lead Time
Lead time, from initial request to completion, encompasses the entire development lifecycle, including work, wait times, reviews, and approvals. It acts as a key indicator of your development process’s efficiency and responsiveness to client needs. By tracking lead time, you can pinpoint bottlenecks, refine your process, and ultimately accelerate your team’s delivery of new features and updates.
Code Coverage
Code coverage is one of the software development KPIs used by the development team to gauge code quality.
Continuous delivery and test-driven development (TDD) are given top priority in this crucial software metric for the software development lifecycle.
This metric tells you how much your source code executes during testing.
Code Simplicity
This software development KPI is hard to measure, however, it provides an essential insight into your product’s success. Coding conventions make code orderly and simple to comprehend. Simple codes are significantly simpler to adapt and maintain, they are preferable to complex code.
A cyclomatic complexity metric is used to measure the number of independent paths, indicating the code’s simplicity by giving a number as an output. Lower the number simpler the code. The higher the number complex the code.
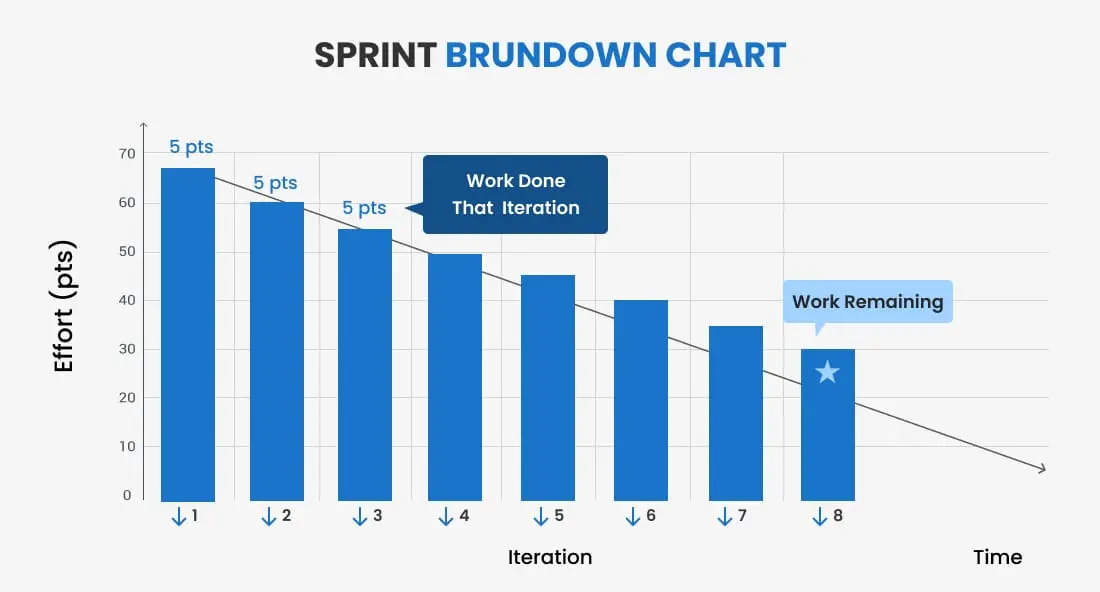
Sprint Burndown
The sprint burndown is the next software metric, which visualizes a sprint’s completed work and contrasts it with its overall scope. Software teams use this measure to monitor sprint completion success.
A development team can spot inconsistencies between expected and actual progress and modify teams’ performance using sprint burndown as a metric. This metric is also used to monitor the progress of story points and identify bottlenecks.
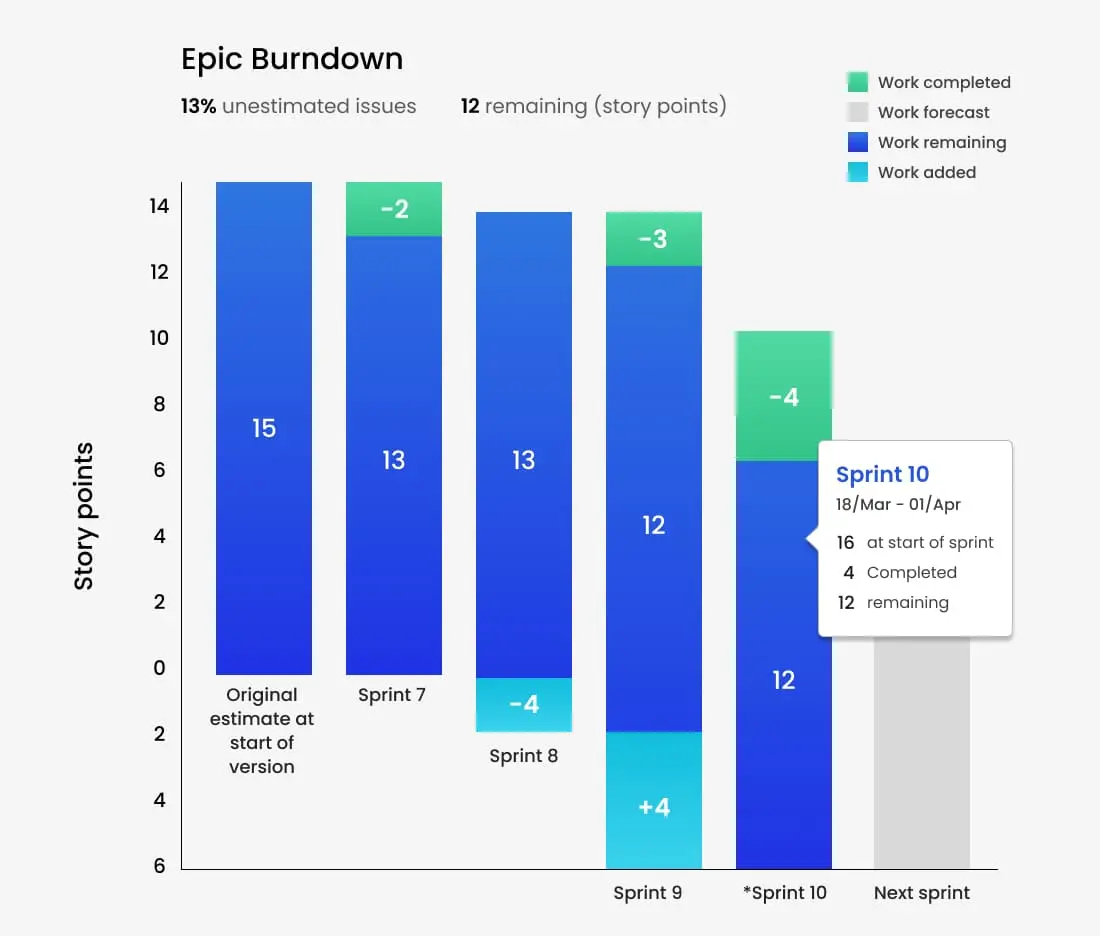
Release Burndown
Release burndown tracks the status of the release. The range of this statistic is wider than sprint burndown. Additionally, the statistic is beneficial since it can guide development teams in controlling the release of a product.
Software teams can use a release burndown chart to determine whether they are on, or exactly on, schedule. When stakeholders can anticipate an ROI post-release, businesses will have hard evidence to support their claims. Release burndown helps in the information about any delays or early launches of the software systems.
Release burndown charts resemble sprint burndown charts in appearance. Story points are plotted on the y-axis, while sprints are represented on the x-axis.
Cumulative Flow
The visual representation of software development is used to follow the progress of work items. It is seen through several stages of the overall development process. The graph displays the number of work items at each workflow stage. Cumulative flow is divided into distinct categories, such as “Backlog,” “In progress,” “In review,” and “Approved” to see the workflow graphically.
Let data be your guide to optimize your software development throughout the lifecycle.
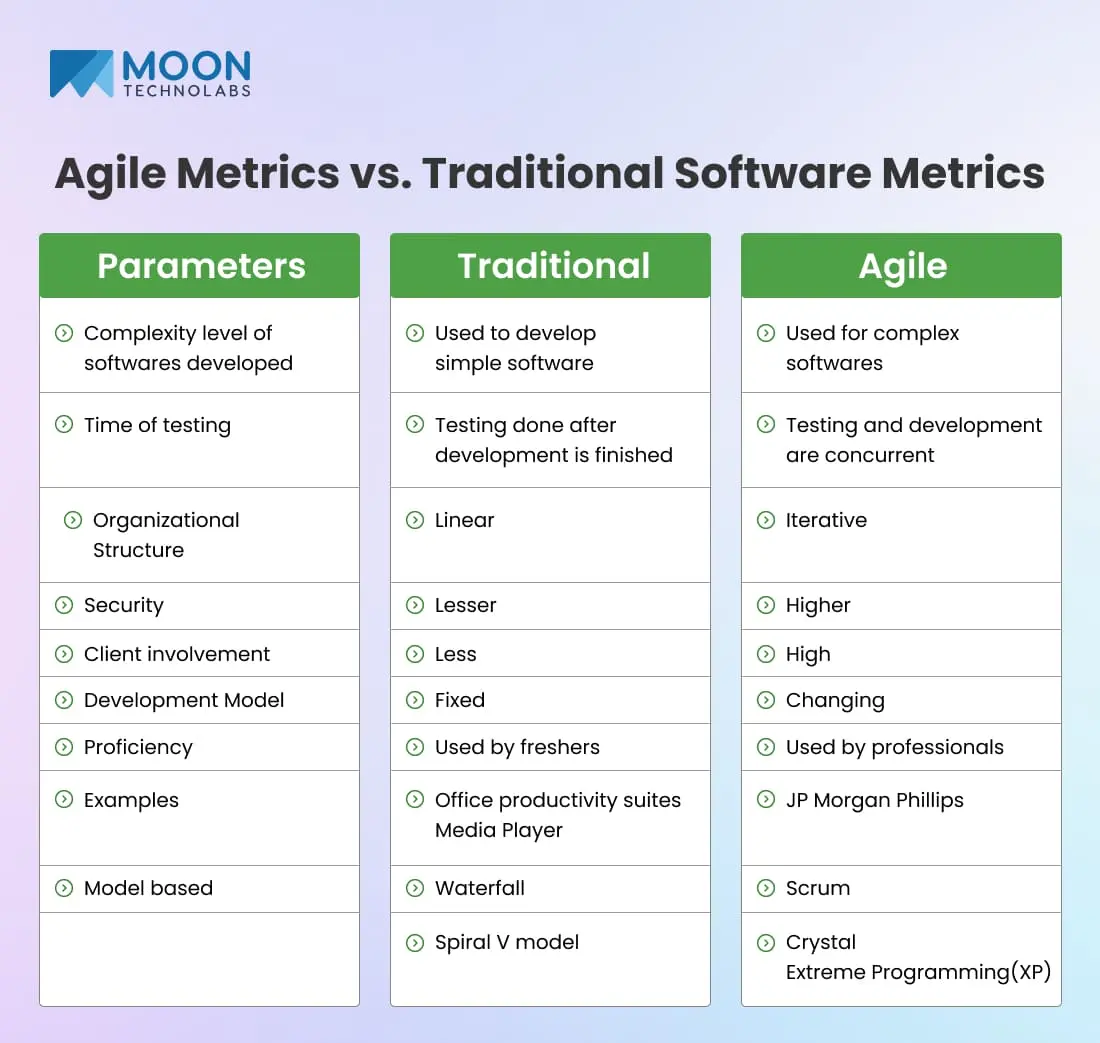
Agile Metrics vs. Traditional Software Metrics
Traditional metrics often paint a blurry picture of software development. While agile methodologies demand a sharper focus. Here you can find a key differences between agile and traditional metrics.
Work Towards Evolving Software Development with Moon Technolabs!
The various software development metrics are used by the development teams to measure progress. By looking at various parameters we can gain valuable insights as to how the software development project is on the scale or how customer satisfaction can be rated with the app’s performance.
One important thing to note is that these key metrics are just a means to an end. Software Metrics serve as the means to reach the end of “providing value” using the software development lifecycle.
Moon Technolabs can help you in your journey of software development lifecycle by implementing the best agile approach and best tools. To ensure that no part of your development experience is ever abandoned or overlooked, Moon Technolabs gives comprehensive data gathered and correlated from several project management tools and software applications.
FAQs
01
How do I ensure continuous improvement in software development?
Data mapping is one method in the development processes used by the software developers. Data you get from various metrics is a great way to measure the improvement in the software system. To know the code quality, you can refer to software development metrics like Code coverage, Code simplicity, and Code stability. Net promoter scale is another key metric to gain valuable insights on customer satisfaction.02
What is KPI in continuous improvement?
Key performance Indicators KPIs are a necessary means to monitor the progress. Performance dashboards are a way to assess performance in your business or provide continuous feedback on your progress. The software displays performance indicators. Creating an improvement plan helps your organization concentrate on achieving goals and gives you suggestions for improvements. The key performance indicators are a kind of measurement tool to know the performance of software development in numbers.03
How can software metrics be of use in software process improvement?
Statistical analysis of processes is a good way to increase software development quality. Examples include effective defect removal while a product develops, test defect arrival patterns, and the turnaround time during the fix. Measurement of projects describes project characteristics and their implementation.
Jayanti Katariya is the CEO of Moon Technolabs, a fast-growing IT solutions provider, with 18+ years of experience in the industry. Passionate about developing creative apps from a young age, he pursued an engineering degree to further this interest. Under his leadership, Moon Technolabs has helped numerous brands establish their online presence and he has also launched an invoicing software that assists businesses to streamline their financial operations.
Submitting the form below will ensure a prompt response from us.
We refine our expertise to deliver innovative business solutions.


205 N Michigan Avenue, #810, Chicago, 60601, Illinois, United States
13500 Long Is Dr, Pflugerville, TX 78660, USA
C/105 Ganesh Meridian, S.G. Highway, Ahmedabad, GJ 380060
Ayse D.
Co-Founder“ I highly recommend Moon Technolabs as the quality of service is wonderful. We have hired this company to develop the product based on some complex & technical issues. We get the best quality services as compared with others in the market. Huge Thanks to Moon Technolabs as the team is always ready to give the solution all time.”
Justin G.
Founder & CEO“ Moon Technolabs is a pioneer in the WebRTC based project as they have fixed complicated segments of the module by fulfilling different product lines by providing 24X7 customer support. We really recommended Moon Technolabs as they are able to develop products as per the module deadline and project timeline.”
Flavio S.
Founder & Managing Director“I am happy to recommend Moon Technolabs for their app development services. They successfully developed apps for me, and I am highly satisfied with the overall outcomes. The development team has swiftly addressed the issues with responsive and effective communication to understand the requirement quickly and actively resolve the back-and-forth problems that arose...”
Jay M.
Founder & CEO“Moon Technolabs is the best company that provides advanced apps and websites development services in the USA and Europe. I am a newbie to develop my app with an external team. I am really happy to work with them as I am not that much mobile apps user. Here, the team and specially the CEO of Moon Technolabs helps me to let me know about the benefits of my app to generate revenue....”


Our Offices
India
C/105 Ganesh Meridian,S.G. Highway, Ahmedabad, GJ 380060USA
205 N Michigan Avenue, #810, Chicago, 60601, Illinois, United StatesContact Information


